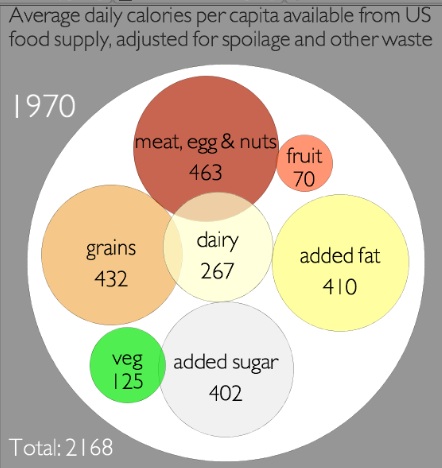
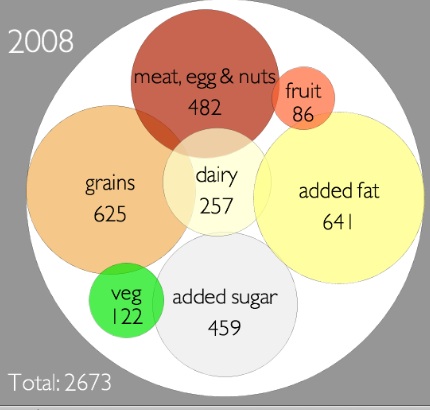
The United State Department of Agricultures loss-adjusted food availability data is one window into where those extra calories come from. While the data does not quite show what is on the average Americans plate, it does provide a pretty good picture of what the population has been consuming since the 1970s. Data on the availability of different foods per capita is adjusted for losses like spoilage and waste. Take for example the produce that goes bad at grocery stores or the leftovers tossed into the compost. By calculating such food losses, the USDA data closely approximates the amount of food that actually makes its way from the farm into the average American stomach.


 Reply with quote
